
The Reproduction Analytics Dashboard provides a high-level overview of your dairy’s breeding and calving performance.
It transforms raw reproductive records into actionable metrics, enabling data-driven decisions that improve fertility, reduce costs, and support herd expansion planning.
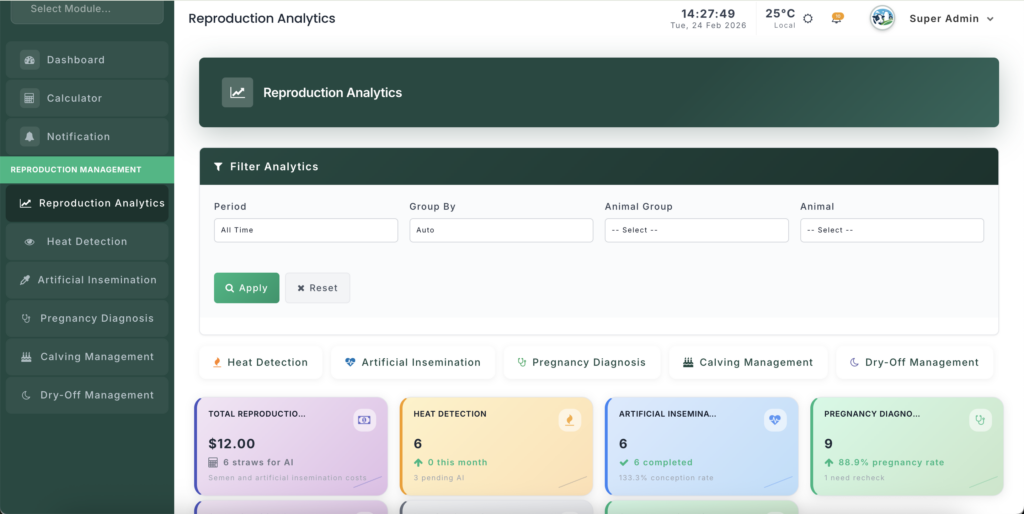
Module URL:http://127.0.0.1:8001/reproduction/analytics
Feature Overview #
This dashboard centralizes key reproduction statistics, including:
🔥 Heat Detection #
- Visibility into animals currently in heat
- Monitoring detection frequency and efficiency
🧬 AI Performance #
- Conception Rate tracking
- AI service counts
- Semen usage monitoring
- Associated breeding costs
🤰 Pregnancy Status #
- Real-time pregnancy rate
- Animals needing pregnancy rechecks
- Confirmed vs. open animals
🐮 Calving Trends #
- Seasonal calving analysis
- Calving success tracking (Normal vs. complications)
📦 Inventory & Expense Tracking #
- Semen straws used
- Total reproduction-related expenses
🚀 How to Use the Analytics Dashboard #
1️⃣ Filter Your Data #
Customize insights to match your management needs.
📅 Time Filters #
- Today
- This Month
- Last Year
- Custom Date Range
🐄 Animal Filters #
- Filter by specific Shed / Group
- Search individual animal performance
📊 Grouping Options #
- View trends Daily
- View trends Monthly
These filters help you analyze short-term fluctuations and long-term fertility trends.
2️⃣ Key Metrics & Summary Cards #
At the top of the dashboard, review these critical KPIs:
💰 Total Reproduction Expenses #
Total cost of:
- Semen straws
- AI technician services
- Related breeding inputs
Useful for budgeting and ROI tracking.
📈 Conception Rate #
Percentage of AI services resulting in confirmed pregnancy.
Formula:
(Confirmed Pregnancies ÷ Total AI Performed) × 100
A primary indicator of breeding efficiency.
🤰 Overall Pregnancy Rate #
Percentage of breeding-age females currently pregnant.
This reflects herd fertility health.
🔥 Heat Detection Status #
Shows:
- Animals currently in heat
- Awaiting insemination
Helps avoid missed breeding windows.
3️⃣ Understanding the Charts #
📊 Reproduction Performance Chart #
Displays:
- Heat detection counts
- AI service counts
- Conception rate trend
This multi-metric chart helps identify correlations such as:
- Increased heat detection but declining conception rate
- Seasonal fertility dips
🐮 Calving Type Breakdown #
Visual representation of:
- Normal calvings
- Dystocia cases
- Stillbirths
Useful for evaluating calving management practices.
📅 Calving Seasonality Trend #
Shows peak calving months across the year.
Helps forecast:
- Labor requirements
- Calf housing needs
- Feed adjustments
4️⃣ Recent Activity Lists #
At the bottom of the dashboard, quickly review the latest 5 records for:
- 🔥 Heat Detections
- 🧬 Artificial Inseminations
- 🤰 Pregnancy Diagnoses
- 🐄 Calving Records
This provides operational visibility without navigating to separate modules.
💡 Best Practices #
📊 Review Conception Rate Monthly #
A sudden decline may indicate:
- Technician performance issues
- Poor semen handling
- Heat stress
- Nutritional deficiencies
Early detection prevents long-term fertility losses.
💰 Track Straw Usage & Expenses #
Use straw consumption data to:
- Budget for breeding season
- Compare cost per confirmed pregnancy
- Identify inefficient breeding cycles
🔁 Monitor Pregnancy Rechecks #
Pay attention to animals marked Need Recheck.
Delayed confirmation:
- Increases open days
- Raises feed costs
- Reduces annual milk productivity
📅 Plan Around Seasonality #
Use calving trends to:
- Anticipate peak workload periods
- Prepare maternity sheds
- Plan feed supply
- Allocate labor efficiently
📈 Management Insight #
Reproductive performance directly impacts:
- Milk production cycles
- Herd expansion rate
- Replacement planning
- Farm profitability
Consistent monitoring of reproduction analytics helps:
- Reduce days open
- Improve conception rates
- Lower breeding costs
- Increase lifetime productivity per cow


Leave a Reply
You must be logged in to post a comment.