
The Supplier Statistics module provides a financial intelligence dashboard for evaluating your farm’s vendor relationships. It offers both a high-level overview comparing all suppliers and a detailed deep-dive into individual supplier transaction histories.
Module URLs:
- Global Overview:
http://127.0.0.1:8001/supplier-statistics - Per-Supplier Details:
http://127.0.0.1:8001/supplier/{id}/statistics
This module aggregates data from multiple transaction sources:
- Stock Purchases – Feed, equipment, and supplies bought.
- Animal Purchases – Livestock acquired from breeders or traders.
- Milk Sales – Raw milk sold to collectors or processors.
- Cow/Calf Sales – Animals sold to buyers or other farms.
🌐 Global Statistics Overview #
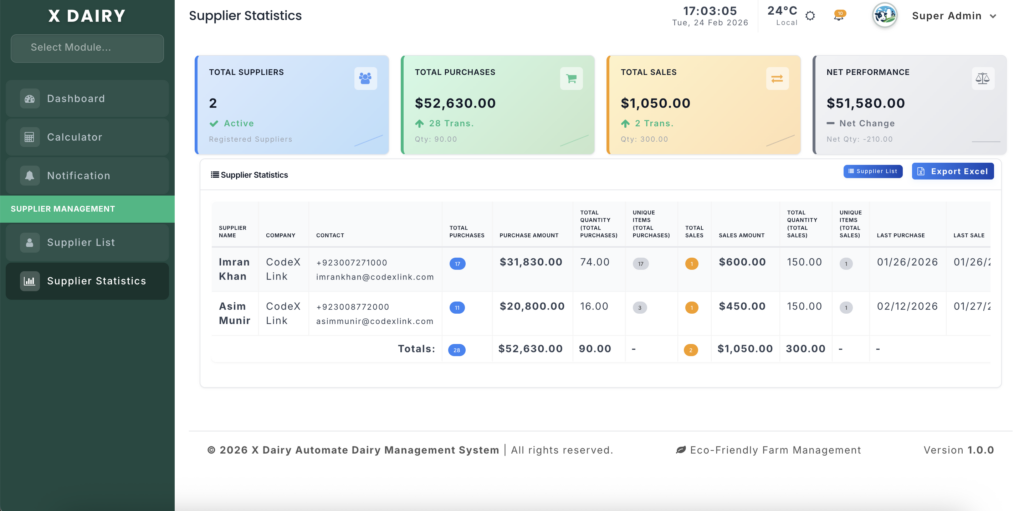
The overview page (/supplier-statistics) gives a bird’s-eye view of all supplier activity.
Summary Cards #
Four cards across the top provide instant farm-wide metrics:
| Card | Description |
|---|---|
| Total Suppliers | Number of registered active suppliers |
| Total Purchases | Total amount spent on purchases, with transaction count and total quantity |
| Total Sales | Total revenue from all sales, with transaction count and total quantity |
| Net Performance | Purchases minus Sales (Net Change) to indicate overall cash flow |
Supplier Comparison Table #
Below the cards, a table lists every supplier with:
- Purchase Metrics: Total transactions, total amount, quantity, unique items purchased, last purchase date.
- Sales Metrics: Total transactions, total revenue, quantity, unique items sold, last sale date.
- Actions:
- Details → View full supplier history.
- Edit → Update supplier profile.
- Footer Totals: Aggregated totals for all suppliers.
Suppliers are sorted by combined transaction value (highest first), highlighting your most active partners.
🔍 Per-Supplier Statistics #
Click Details on any supplier to open a deep-dive page with five sections:
1️⃣ Summary Cards #
Four cards display the supplier’s lifetime totals:
- Total Purchases – Count of purchase transactions.
- Purchase Amount – Total money spent, with average per transaction.
- Total Sales – Count of sales transactions.
- Sales Amount – Total revenue, with average per transaction.
2️⃣ Items Purchased from Supplier #
Table showing each item purchased:
- Category, Unit, Total Quantity, Total Amount, Transaction Count
- Average Price per Unit
- First and Last Purchase Dates
3️⃣ Items Sold to Supplier #
Same structure as purchases, for outgoing goods (milk, livestock, stock items).
4️⃣ Monthly Statistics #
Side-by-side tables for Purchases and Sales:
- Transaction count, quantity, and total amount per month
- Sorted newest first for easy trend spotting
5️⃣ Full Transaction History #
Chronological logs of Purchase History and Sales History:
- Date, Item Name, Category, Quantity, Unit Price, Total Amount, Reference Number, Entry Creator
- Footer totals for reconciliation
💡 Best Practices #
- Quarterly Reviews: Use the global overview to identify top 5 suppliers by spend; negotiate better rates with high-volume partners.
- Price Tracking: Monitor the “Average Price” per item; switch or renegotiate if costs are significantly higher than alternatives.
- Activity Monitoring: Review “Last Purchase” and “Last Sale” dates to identify dormant relationships and maintain partnerships.
- Net Performance: Track the Net Performance card to monitor overall cash flow; a high positive number indicates more spend than revenue from supplier channels.


Leave a Reply
You must be logged in to post a comment.